
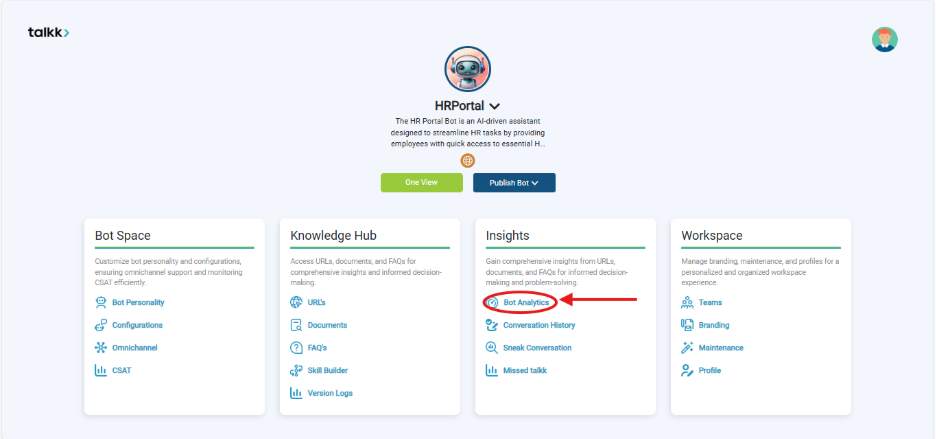
2. Dashboards
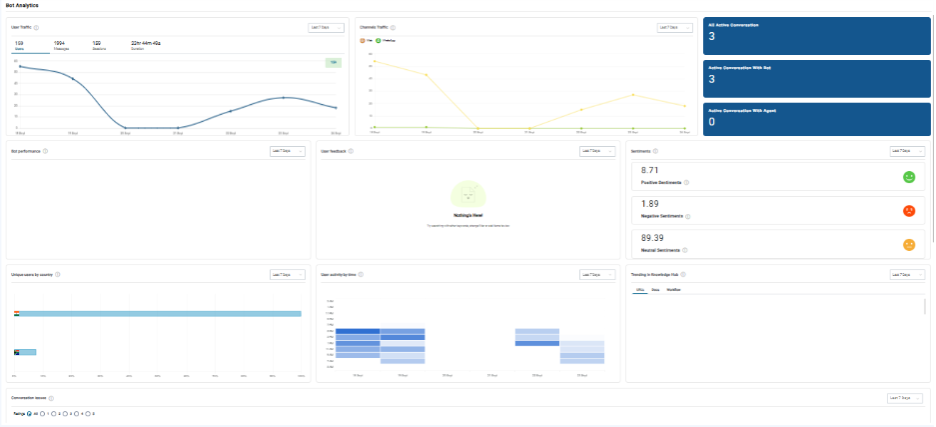
2.1 User Traffic (Graph – Top Left)
- What it shows: Number of users interacting with the bot over time.
- How to use: Track peak/busy hours to optimize support availability.
2.2 Channel Traffic (Graph – Top Middle)
- What it shows: Breakdown of conversations by channel (e.g., Web, WhatsApp).
- How to read:
- X-axis: Dates (last 7 days).
- Y-axis: Number of conversations.
- Insights from example:
- Web peaked on 18 Sept (~55 chats), dropped to zero on 20–21 Sept, then recovered.
- WhatsApp remained consistently low (0–1 chats).
- How to use:
- Compare channel performance to see where engagement is strongest.
- Investigate sudden drops (could be technical or engagement issues).
- Align with campaigns to measure channel impact.
2.3 Conversation Counters (Top Right – Blue Boxes)
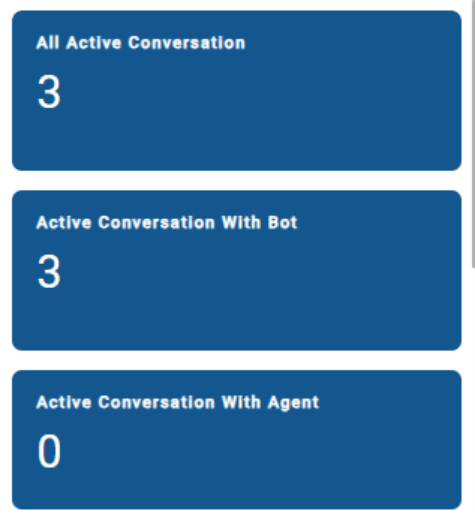
- All Active Conversations: Total number of live conversations.
- Active Conversations with Bot: Ongoing chats being handled by the bot.
- Active Conversations with Agent: Chats handed over to human agents.
2.4 Sentiment Analysis (Right Center)
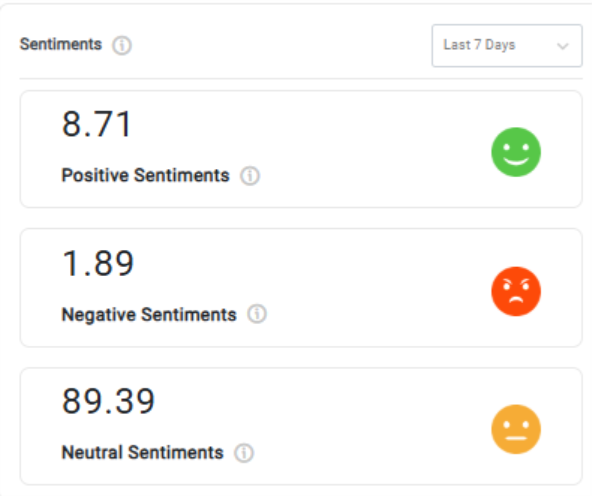
- Positive Sentiments (%): Users showing satisfaction.
- Negative Sentiments (%): Users showing frustration/confusion.
- Neutral Sentiments (%): Neutral/undetermined tone.
- How to use: Spot negative trends → adjust bot flows or FAQs.
2.5 Bot Performance (Middle Left)->Coming Soon
- What it shows: Flow completion success rates (currently blank in screenshot).
- How to use: Monitor which flows (Quote, Callback, Redemption, etc.) complete vs fail.
2.6 User Feedback (Middle Center)
- What it shows: Direct user ratings/comments (if feedback is enabled).
- How to use: Track qualitative improvement areas.
2.7 Unique Users by Geography (Bottom Left)
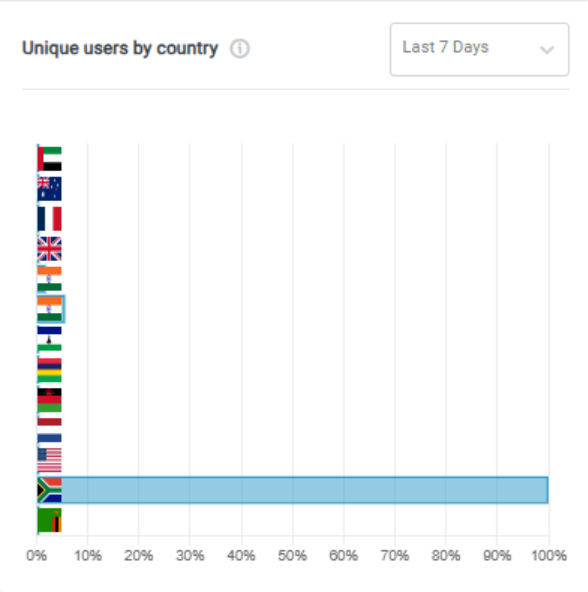
- What it shows: Displays where users are located — by country or region — along with engagement metrics like number of sessions or messages.
- How to use: See which regions engage most with the bot.
2.8 User Activity by Time (Bottom Middle)
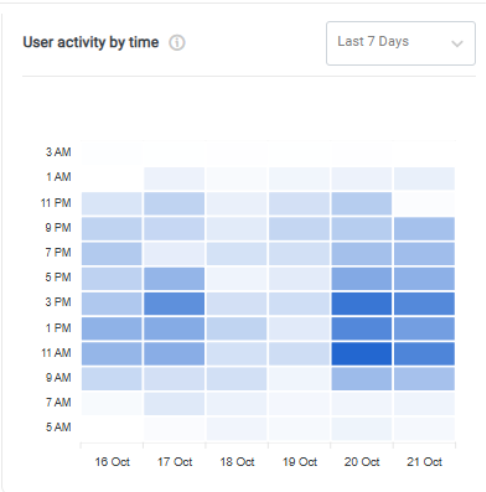
- What it shows: Heatmap of user activity across time of day.
- How to use: Identify high-demand slots to schedule staff/API scaling.
2.9 Trending Knowledge Hub (Bottom Right)
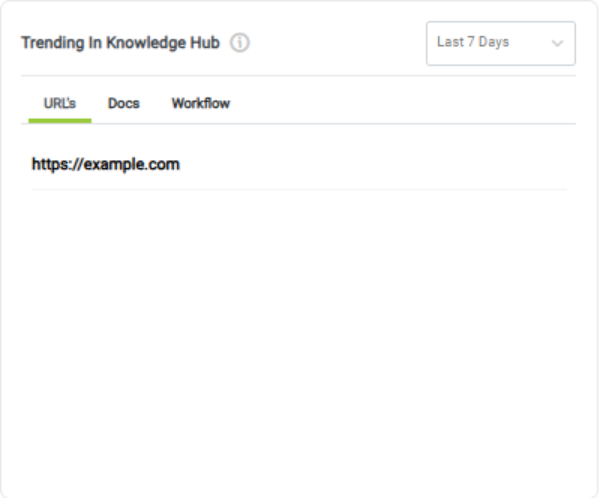
- What it shows: Most frequently accessed FAQs/knowledge base articles. Workflow-coming soon
- How to use: Spot trending topics → ensure content is accurate & updated.
3. Reports Section (Side Menu)
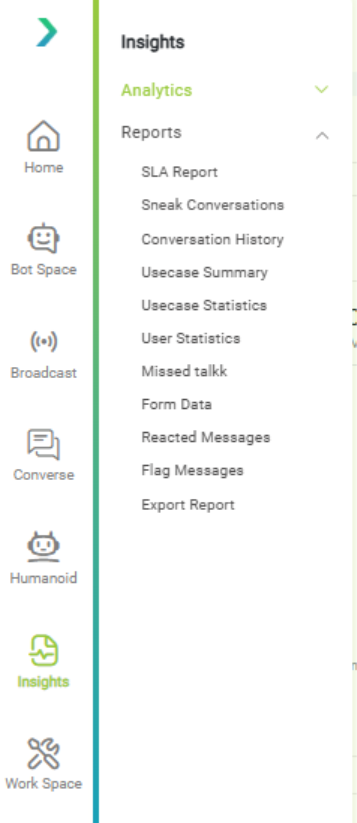
3.1 SLA Report
Monitors response and resolution times to ensure support standards are met.
3.2 Sneak Conversations
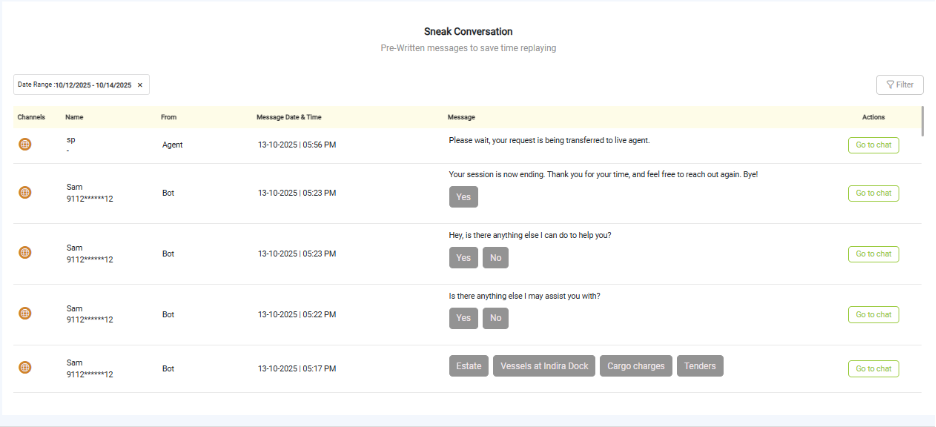
Quick view of recent or active conversations for real-time monitoring.
3.3 Conversation History
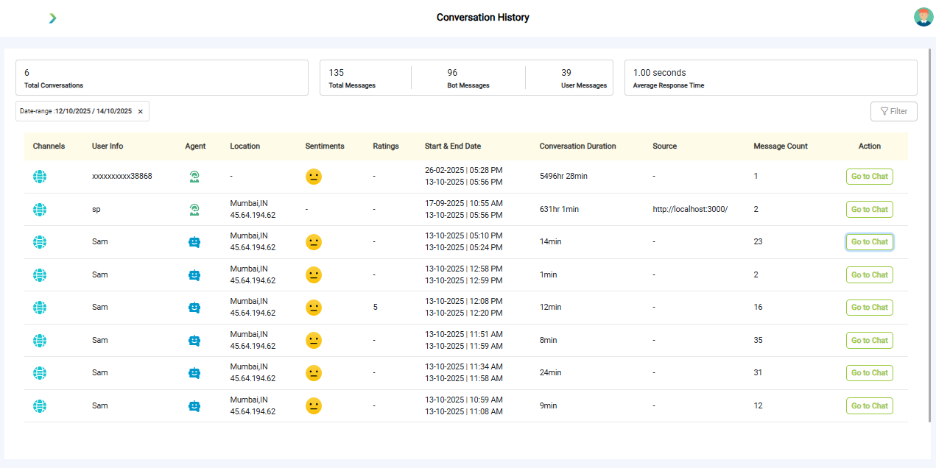
- Conversation Table Columns
- Channels: Source of the conversation (e.g., web, app)
- User Info: Identifier or masked details of the user
- Agent: Assigned bot or human agent
- Location: User’s location with IP address
- Sentiments: Emoji-based sentiment indicators
- Ratings: User feedback (if available)
- Start & End Date: Timestamp of conversation duration
- Conversation Duration: Total time of interaction
- Source: Referrer or origin URL
- Message Count: Number of messages exchanged
- Action: Button to view full conversation (“Go to Chat”)
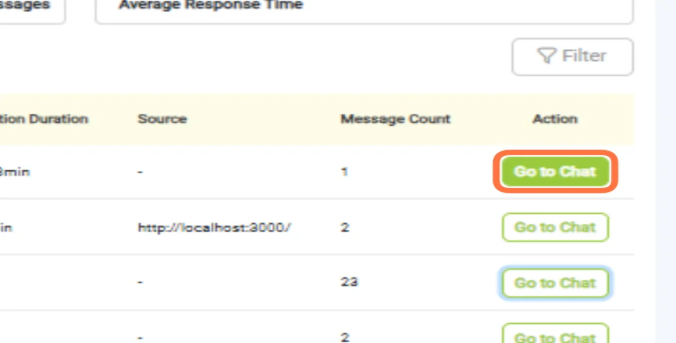
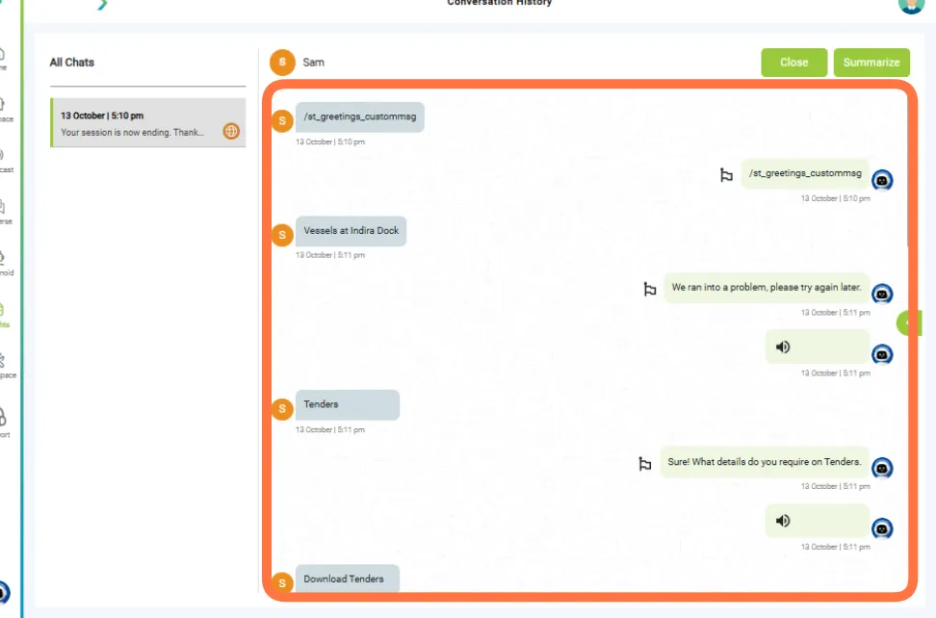
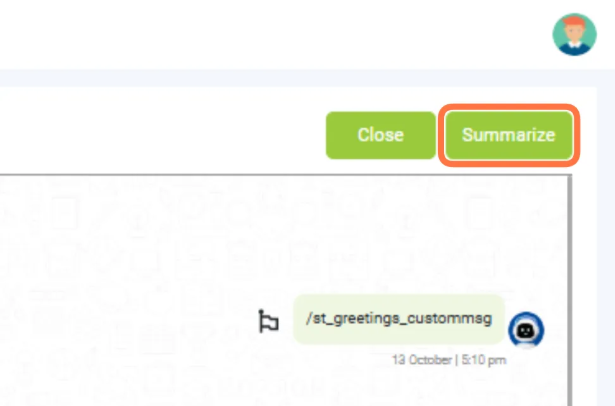
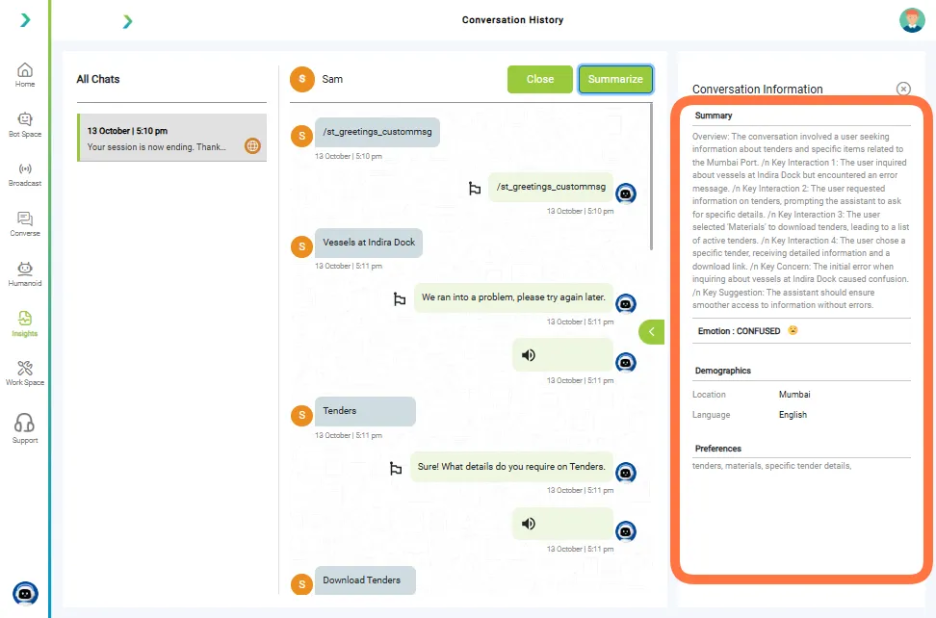
After clicking “Go to Chat” in the dashboard, the interface opens a detailed conversation history view. Here’s what it typically shows:
3.4 Usecase Summary
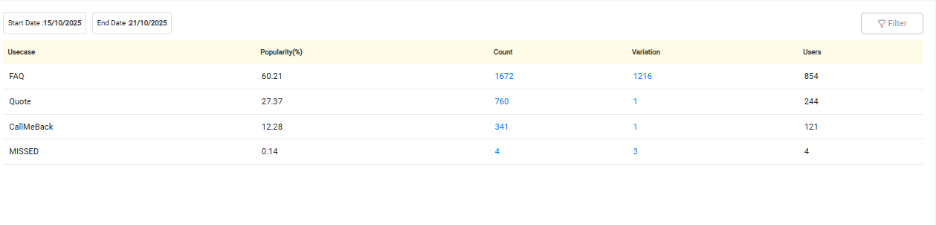
Overview of bot use case performance and success rates.
3.5 Usecase Statistics
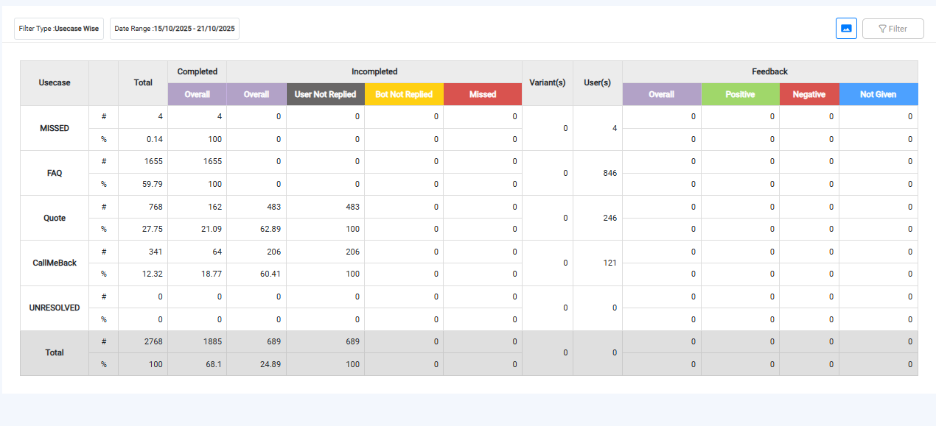
Displays performance metrics for each use case (e.g., FAQ, CallMeBack) over a selected date range.
Includes:
- Total interactions
- Completed & Incompleted counts
- User feedback (Positive, Negative, Not Given)
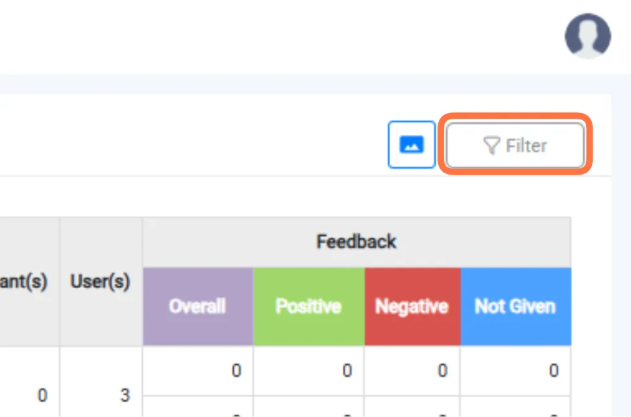
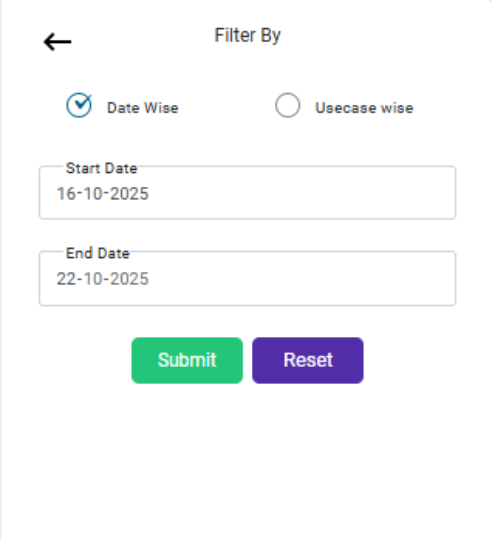
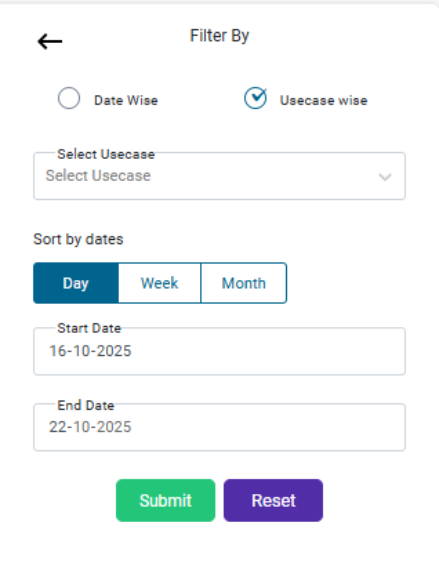
- Date Wise – View engagement based on a selected date range.
- Usecase Wise – View engagement based on specific use cases or bot functionalities.
3.6 User Statistics
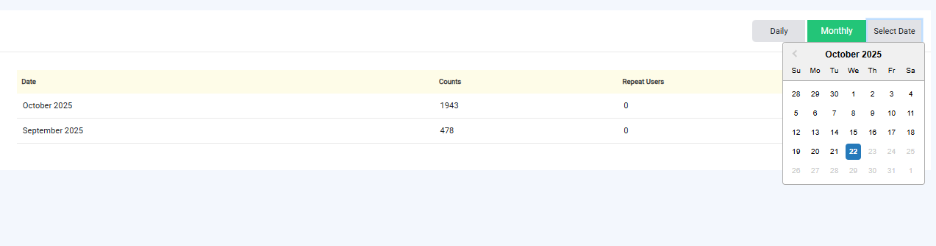
Data on user types, demographics, and engagement frequency.
3.7 Missed Talkk
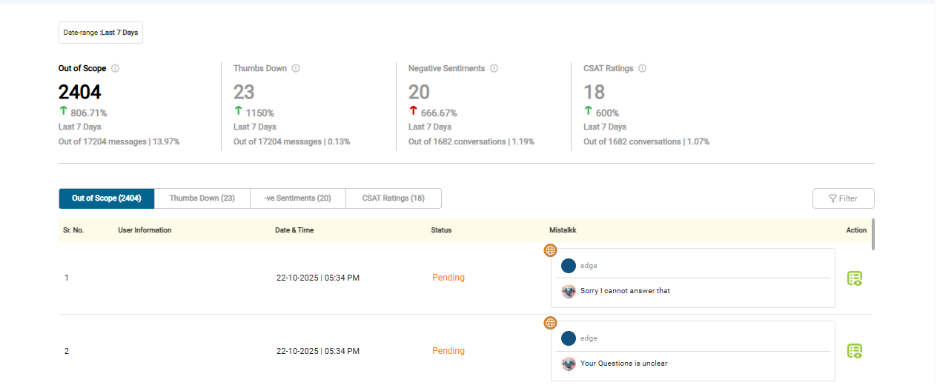
Displays key metrics for conversations where the bot couldn’t respond effectively. Includes:
- Out of Scope – Bot didn’t understand the query
- Thumbs Down – Users gave negative feedback
- Negative Sentiments – Detected negative tone in messages
- CSAT Ratings – Customer satisfaction scores
Each tab shows detailed entries with ID, Date/Time, Status, and Message Details to help review and improve bot responses
3.8 Form Data
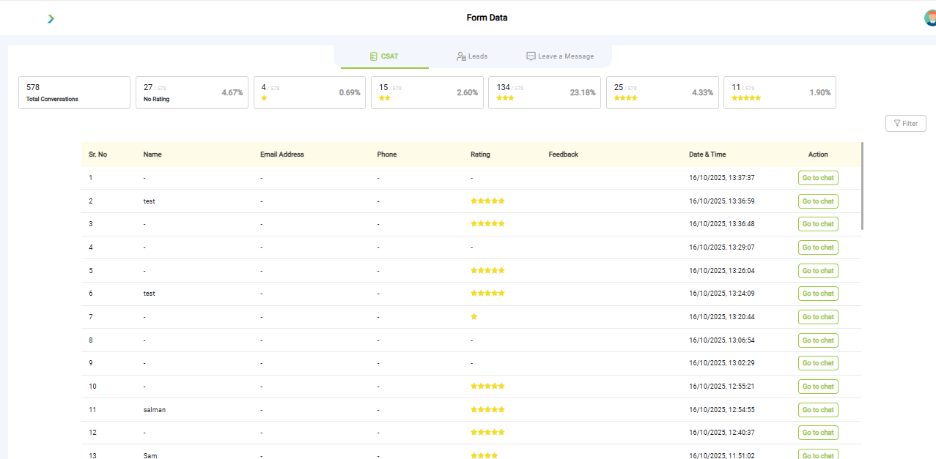
Shows customer satisfaction ratings from chat interactions
Each entry includes user details, rating, feedback, timestamp, and a “Go to chat” button for reviewing specific conversations.
Lead Form
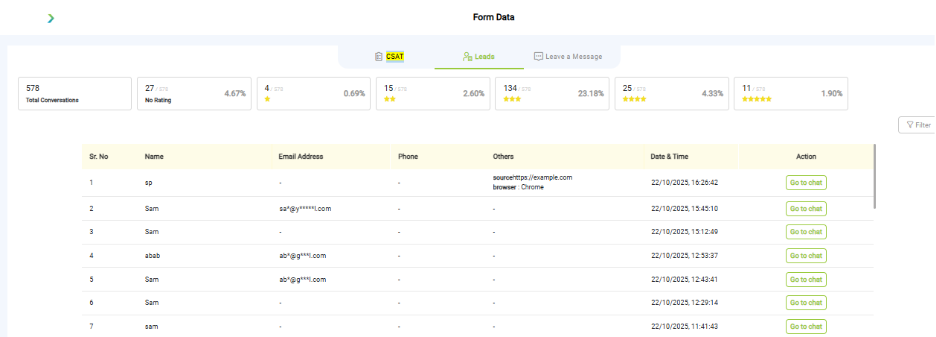
Appears at the start of a bot conversation to collect user details like:
- Name
- Phone
- Other info (e.g., browser, source)
Leave a Message
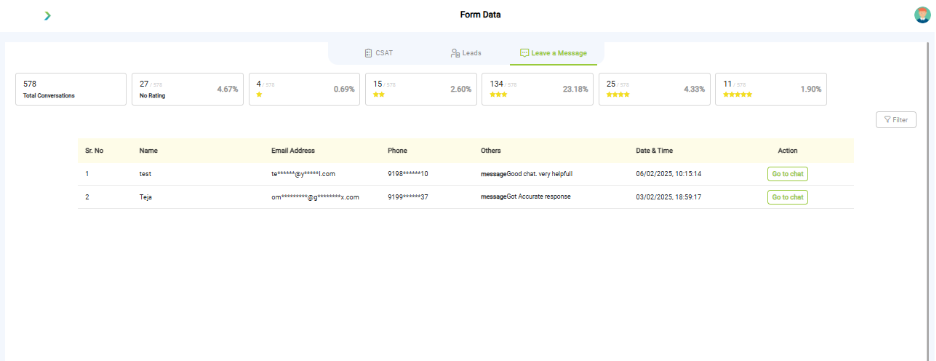
Appears at the end of a conversation to collect user feedback.
Captures:
- Name
- Phone
- Message or comment
Helps gather insights on user experience and satisfaction after the chat ends.
3.9 Reacted Messages
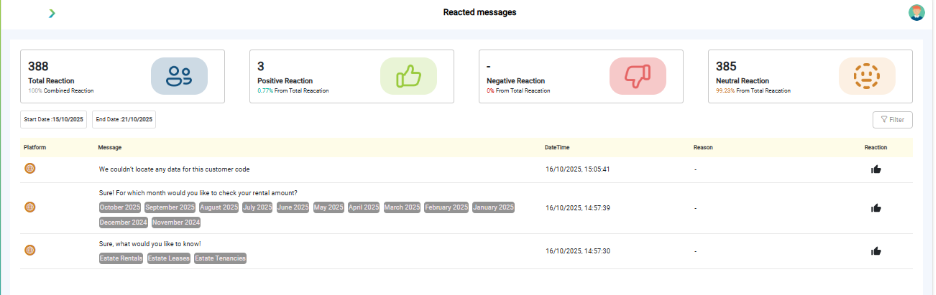
Tracks user reactions to messages for feedback analysis.
- 3.10 Flag Messages
- Highlight messages flagged for moderation or review.
3.11 Export Report
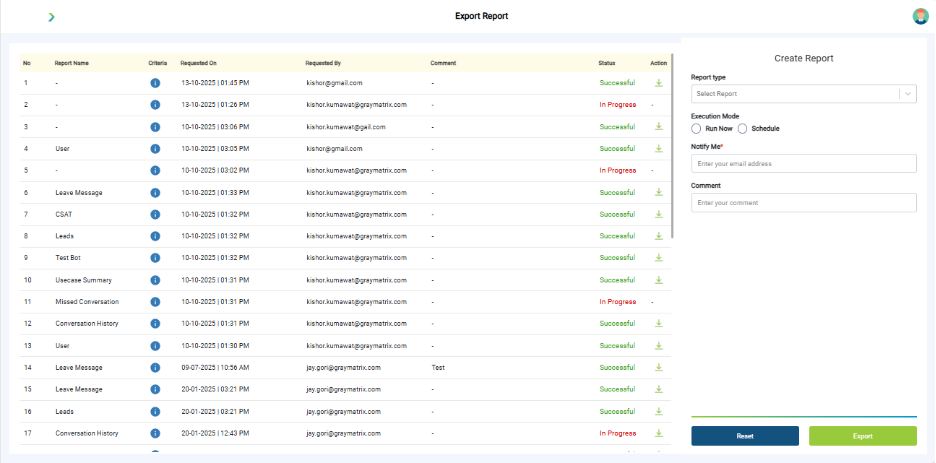
Enables downloading report data for external analysis.
Troubleshooting
| Symptom | Why it happens | What to do |
| Dashboard empty | Bot not live | Publish bot and recheck after interactions. |
| No sentiment data | Not enabled | Turn on sentiment tracking in configuration. |
| Traffic mismatch | Wrong date filter | Adjust range to correct timeline. |
| Channel traffic missing | Channel not integrated | Connect under Channel Integrations. |
Best Practices
- Use Analytics as early warning system for issues.
- Benchmark traffic and sentiment monthly.
- Share dashboard reports with leadership for transparency.
- Correlate analytics with Broadcast campaigns and Converse workload.
What’s Next?
- 📑 SLA Report → Check agent response/resolution compliance.
- 👀 Sneak Conversations → Monitor ongoing live chats.
- 📜 Conversation History → Review transcripts.